
Beyond Demographics: China’s Shift from Population Dividend to Productivity Dividend
China Structural Challenges #4

China’s population decline is real. But the most common conclusion drawn from it—that China is therefore entering an irreversible economic decline—is far less solid than it sounds. Aging is accelerating. Births remain weak. The total population has already turned downward. None of that is in dispute. What is in dispute is the leap from demographic deterioration to economic inevitability.
That leap is too crude. For a large economy, the decisive variable is not simply how many people it has, but how much effective labor each person embodies. In growth-accounting terms, what matters is not the headcount alone, but the interaction between labor quantity, human capital, and technology. A falling population weakens the first term. It does not predetermine the trajectory of the whole system.
In simplified form:
Effective labor = Labor force size × Human capital × Technology-complementarity efficiency
This is the real battleground. If labor quantity falls but education, skills, automation, and technological diffusion rise fast enough, aggregate growth can continue. The question, then, is not whether demographics will “crush” China. The real question is whether productivity can rise fast enough, and persistently enough, to outrun the demographic headwind.
I. How binding is the demographic constraint?
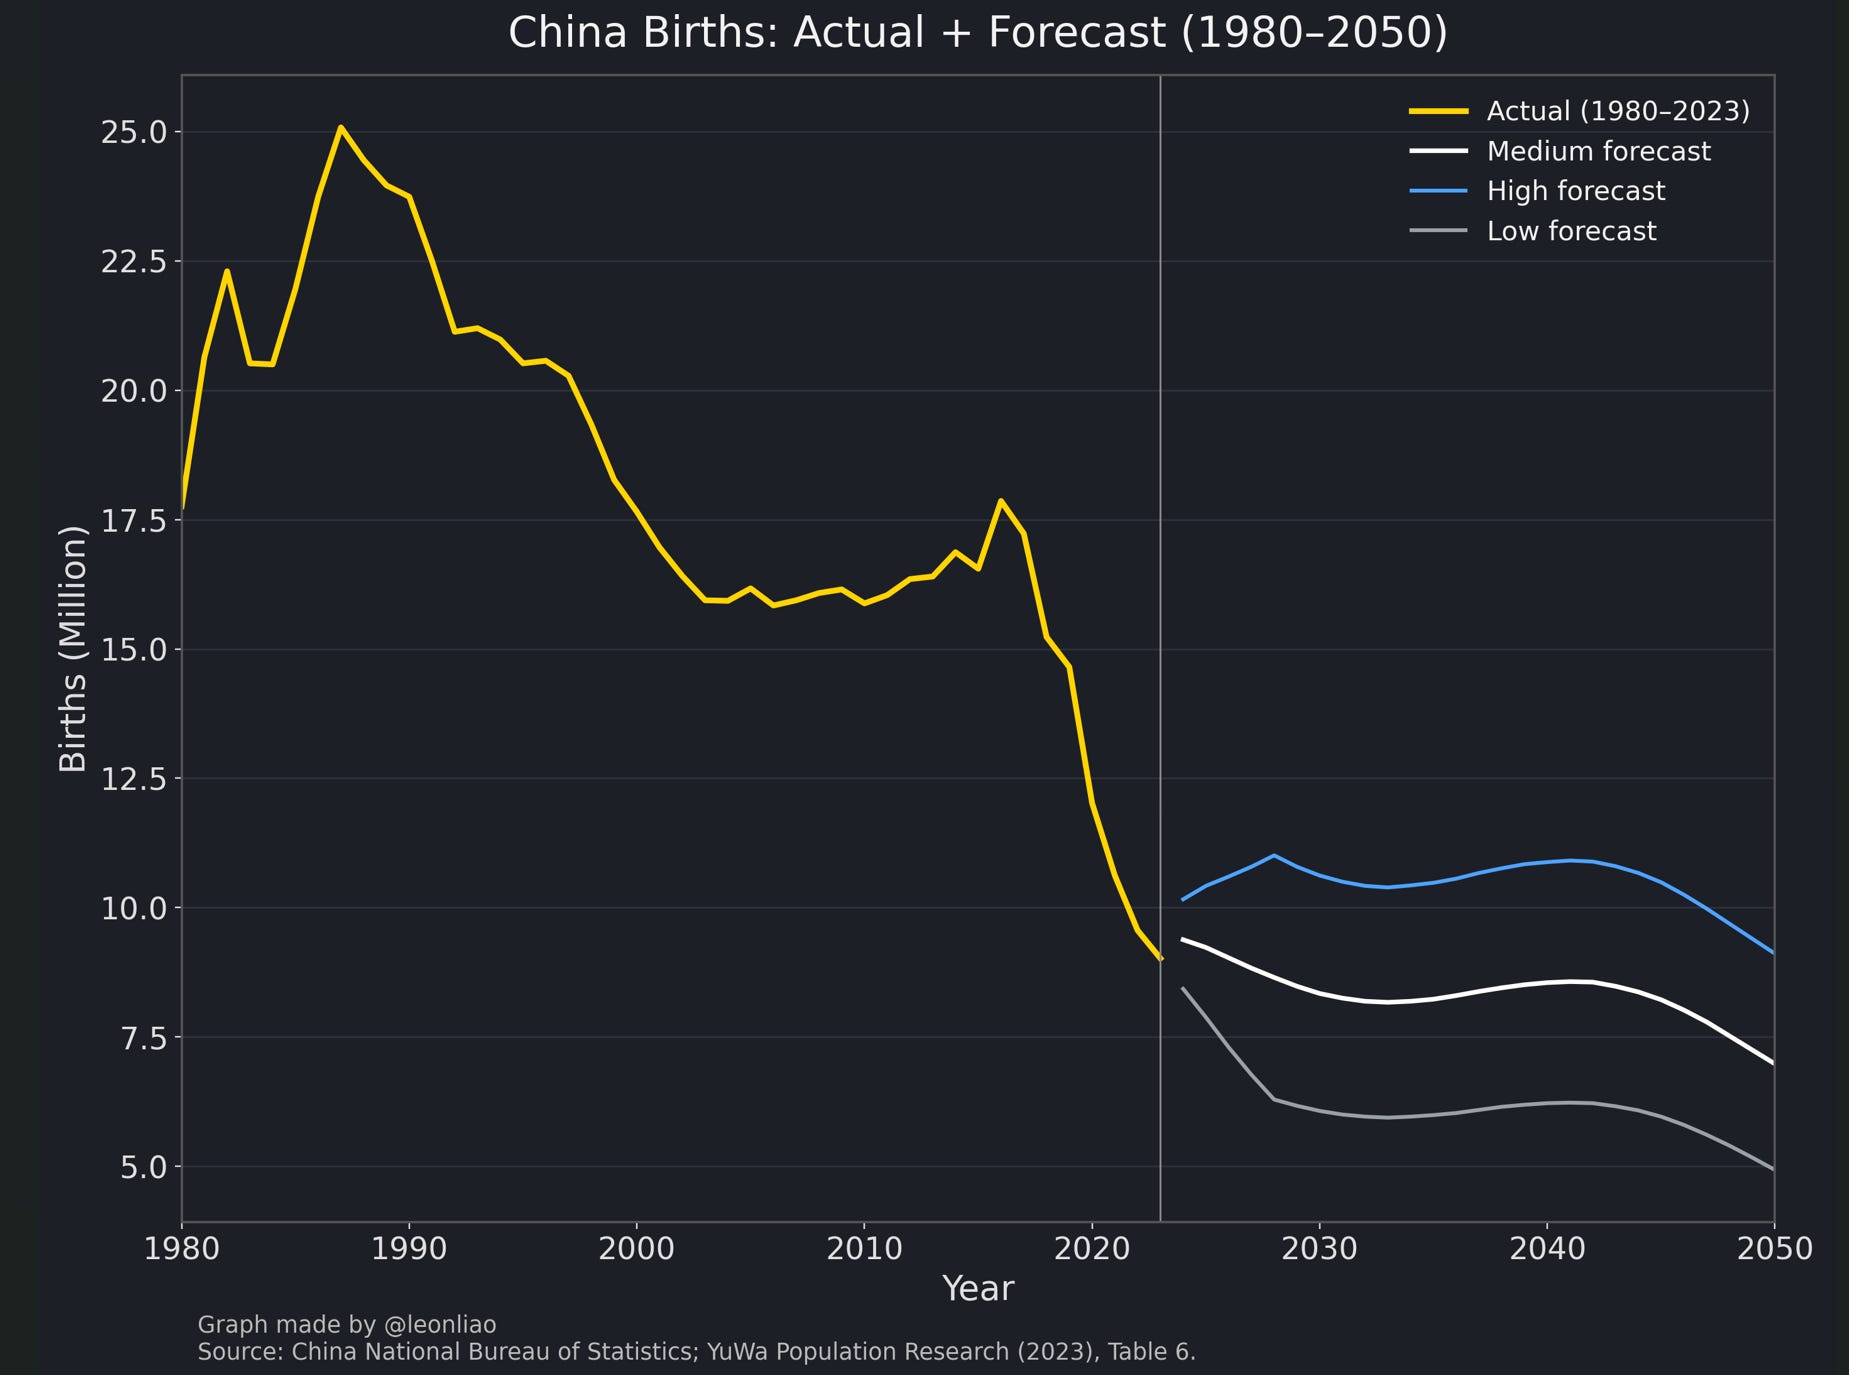
According to YuWa Population Research (one of the most influential research institutes in China on demography), under the low scenario, if China’s fertility rate continues to fall from around 0.9 toward roughly 0.8 (with South Korea as a reference: despite nontrivial pronatalist efforts, Korea’s TFR was already as low as 0.84 in 2020 and fell further to 0.81 in 2021), China’s population would decline to 1.172 billion by 2050. Under this low-fertility scenario, the working-age population share falls to 60% by 2050 (from 70% now).
China is projected to enter a “super-aged society” around 2032, meaning in roughly a decade, and then continue climbing rapidly to 32.54% by 2050. Only aggressive fertility-support policies, on the order of fiscal spending equivalent to about 5% of GDP on average, could keep fertility close to the Western average of around 1.4.
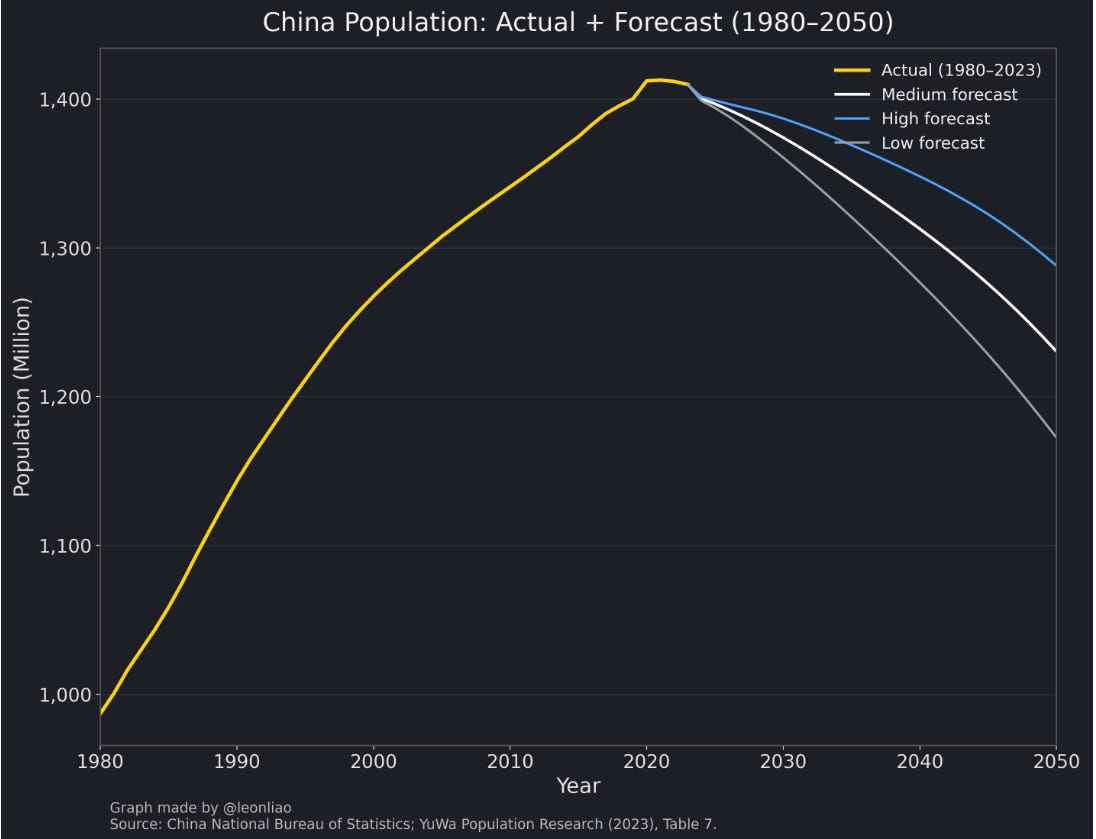
If over the next 25 years China’s population falls from 1.4 billion to 1.172 billion, a decline of 16% (roughly equivalent to subtracting the combined populations of Russia and Japan), what does that imply? It translates into an average demographic headwind of roughly -0.8% per year to growth. This is not a one-off collapse, but a persistent negative term.
II. Capital accumulation and TFP can still offset population decline
Over 2013–2023, China’s real GDP grew at an average annual rate of 6.05%. The capital stock grew at 8.32% per year. With an average capital share of 43%, capital input contributed about 3.58 percentage points to annual GDP growth, roughly two-thirds of the total. Labor grew by about 0.5% per year, contributing about 0.3 percentage points annually. Average TFP growth was 2.17% per year. Conceptually, TFP reflects a composite of technological progress, allocative efficiency, institutions and governance, industrial upgrading, management efficiency, and the speed of diffusion.
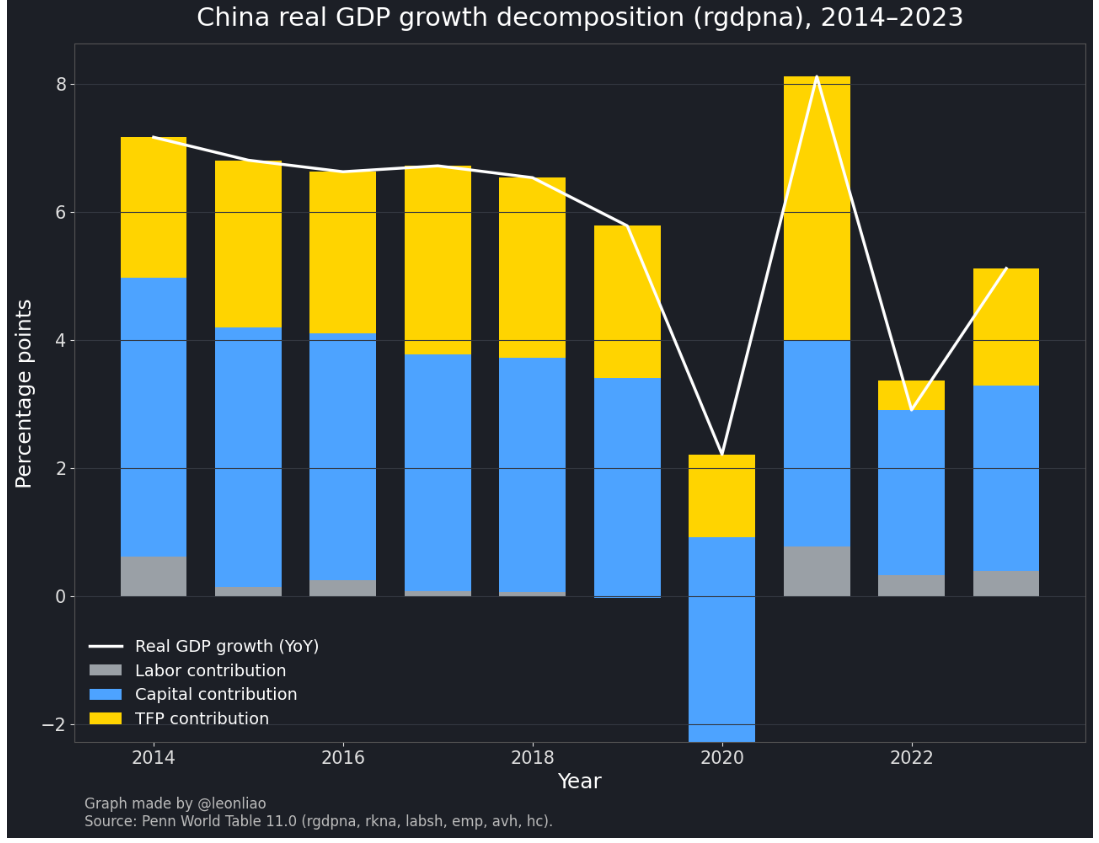
Suppose over the next 25 years labor force growth turns to -0.8% per year. That would mechanically drag real GDP growth by about 0.46 percentage points annually. Meanwhile, if capital stock growth slows to 5.6% (given China’s current productivity stage is roughly comparable to South Korea around 1995, and Korea’s 1995–2023 capital-stock CAGR was 5.60% per year), then the average capital contribution would be about 2.4 percentage points. Labor plus capital together would then imply around 1.94 percentage points of real GDP growth.
Reframed through growth accounting, population itself is not the decisive variable. What matters is not “how many people remain,” but whether effective labor continues to rise—in other words whether productivity can sustainably outrun the demographic headwind.
To assess that, the first step is to locate China’s current stage of productivity development. Three indicators are useful.
The first is manufacturing value added per capita. China’s total manufacturing value added is the largest in the world, yet manufacturing value added per capita is only about $3,200. That is roughly comparable to South Korea in the early 1990s and far below advanced economies. Germany’s manufacturing value added per capita is more than three times China’s. The United States, South Korea, and Japan are about 2.0–2.5 times. France and the UK are also more than 1.5 times. This suggests that while China’s manufacturing is huge in scale, it is still not strong enough on a per-person basis.
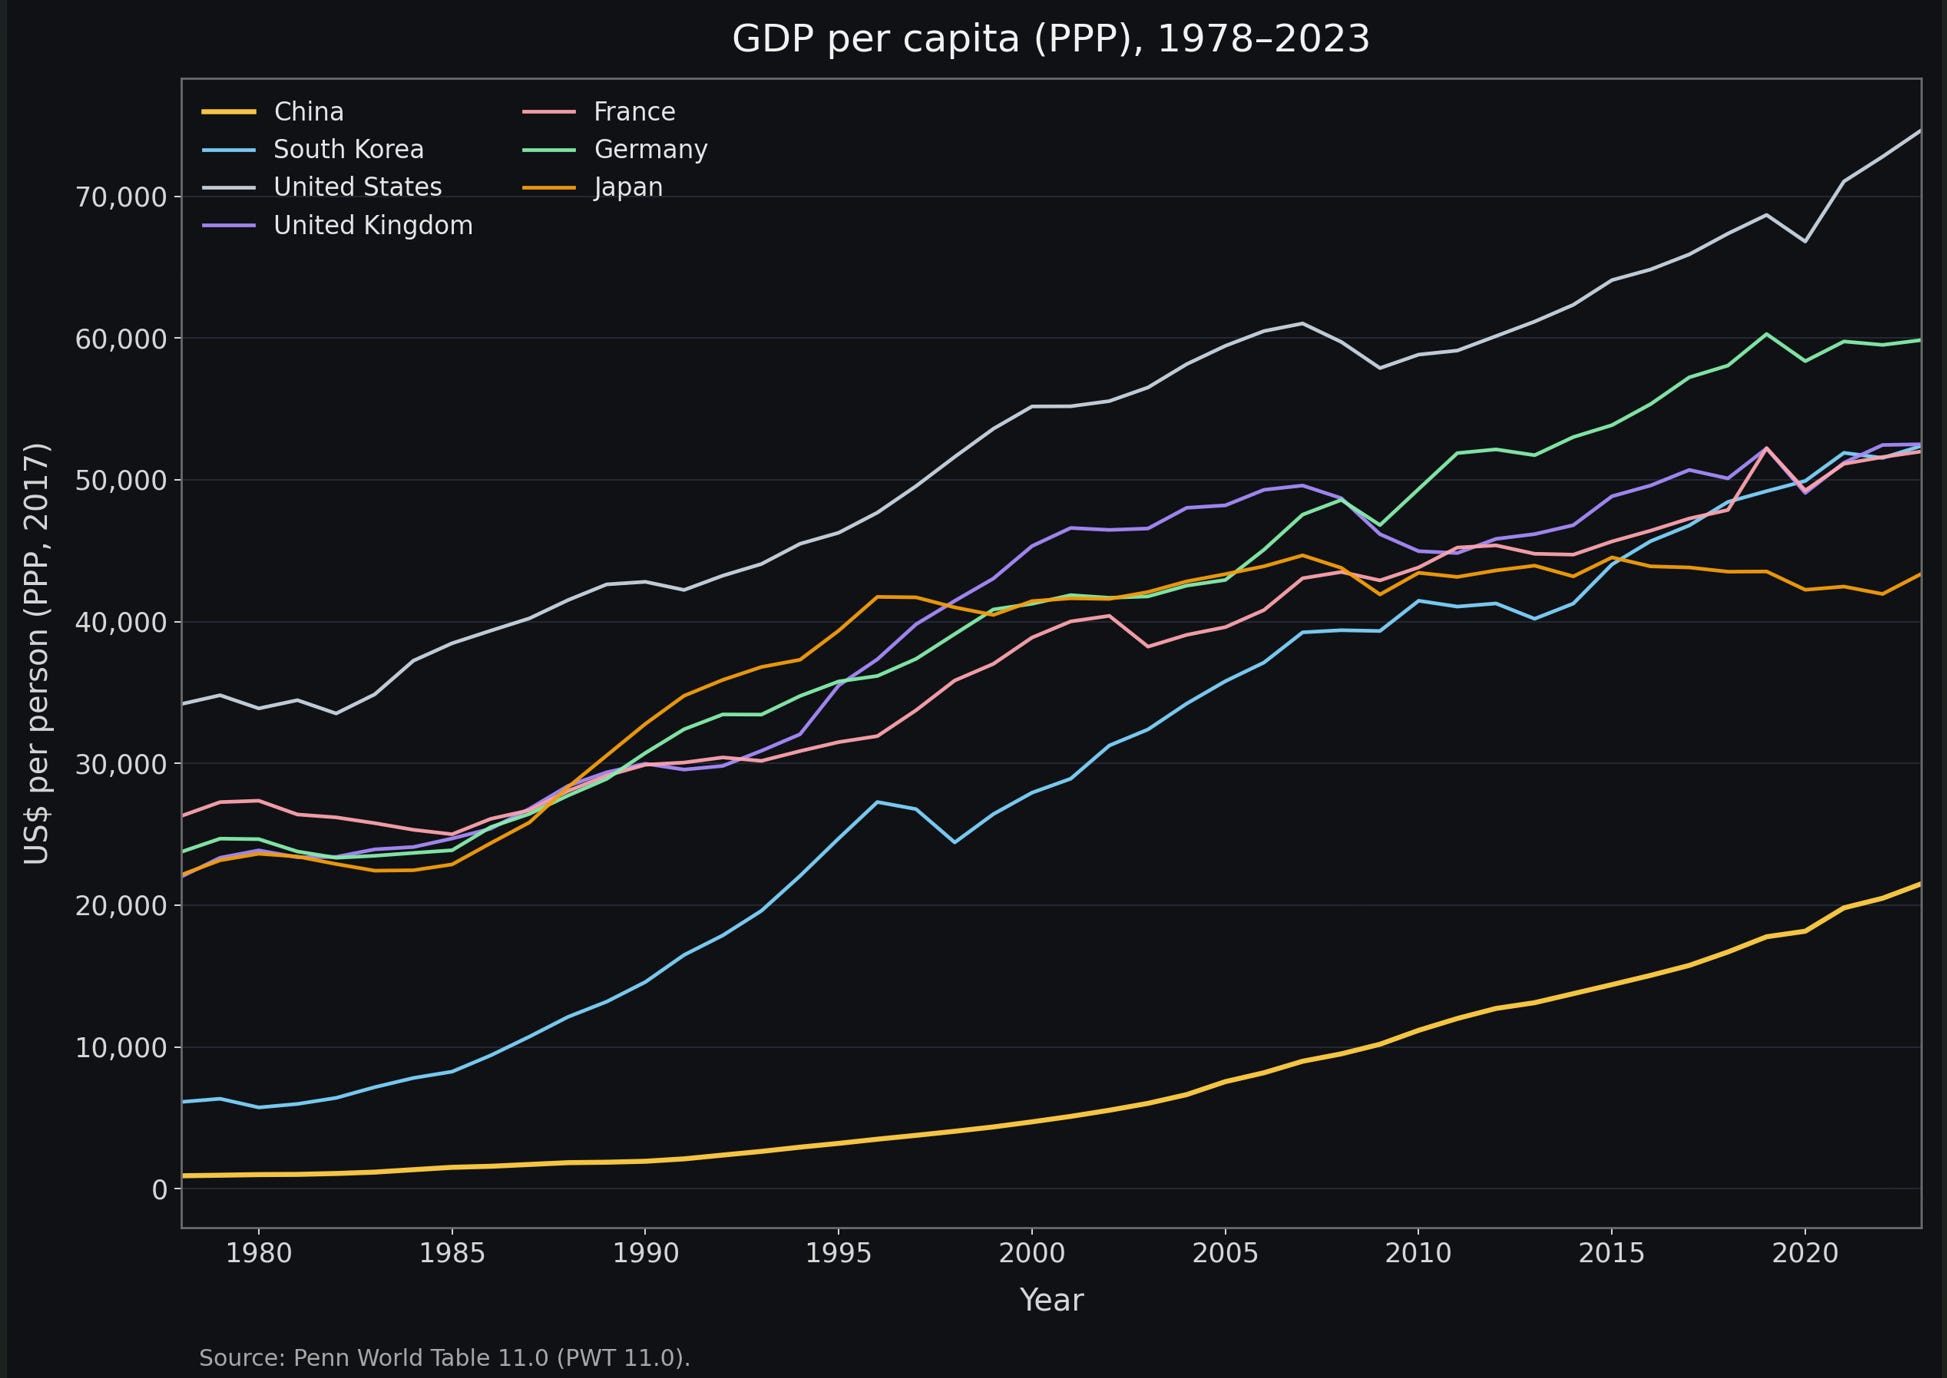
The second indicator is GDP per capita (PPP). China is currently around 22,000 international dollars, roughly the absolute level of South Korea in the mid-1990s. Today the US is more than three times China. Germany is around 2.7 times. The UK, France, and South Korea are about 2.2 times, and Japan is about two times. This implies that China’s per-capita real productivity and per-capita real income still have substantial room to grow.
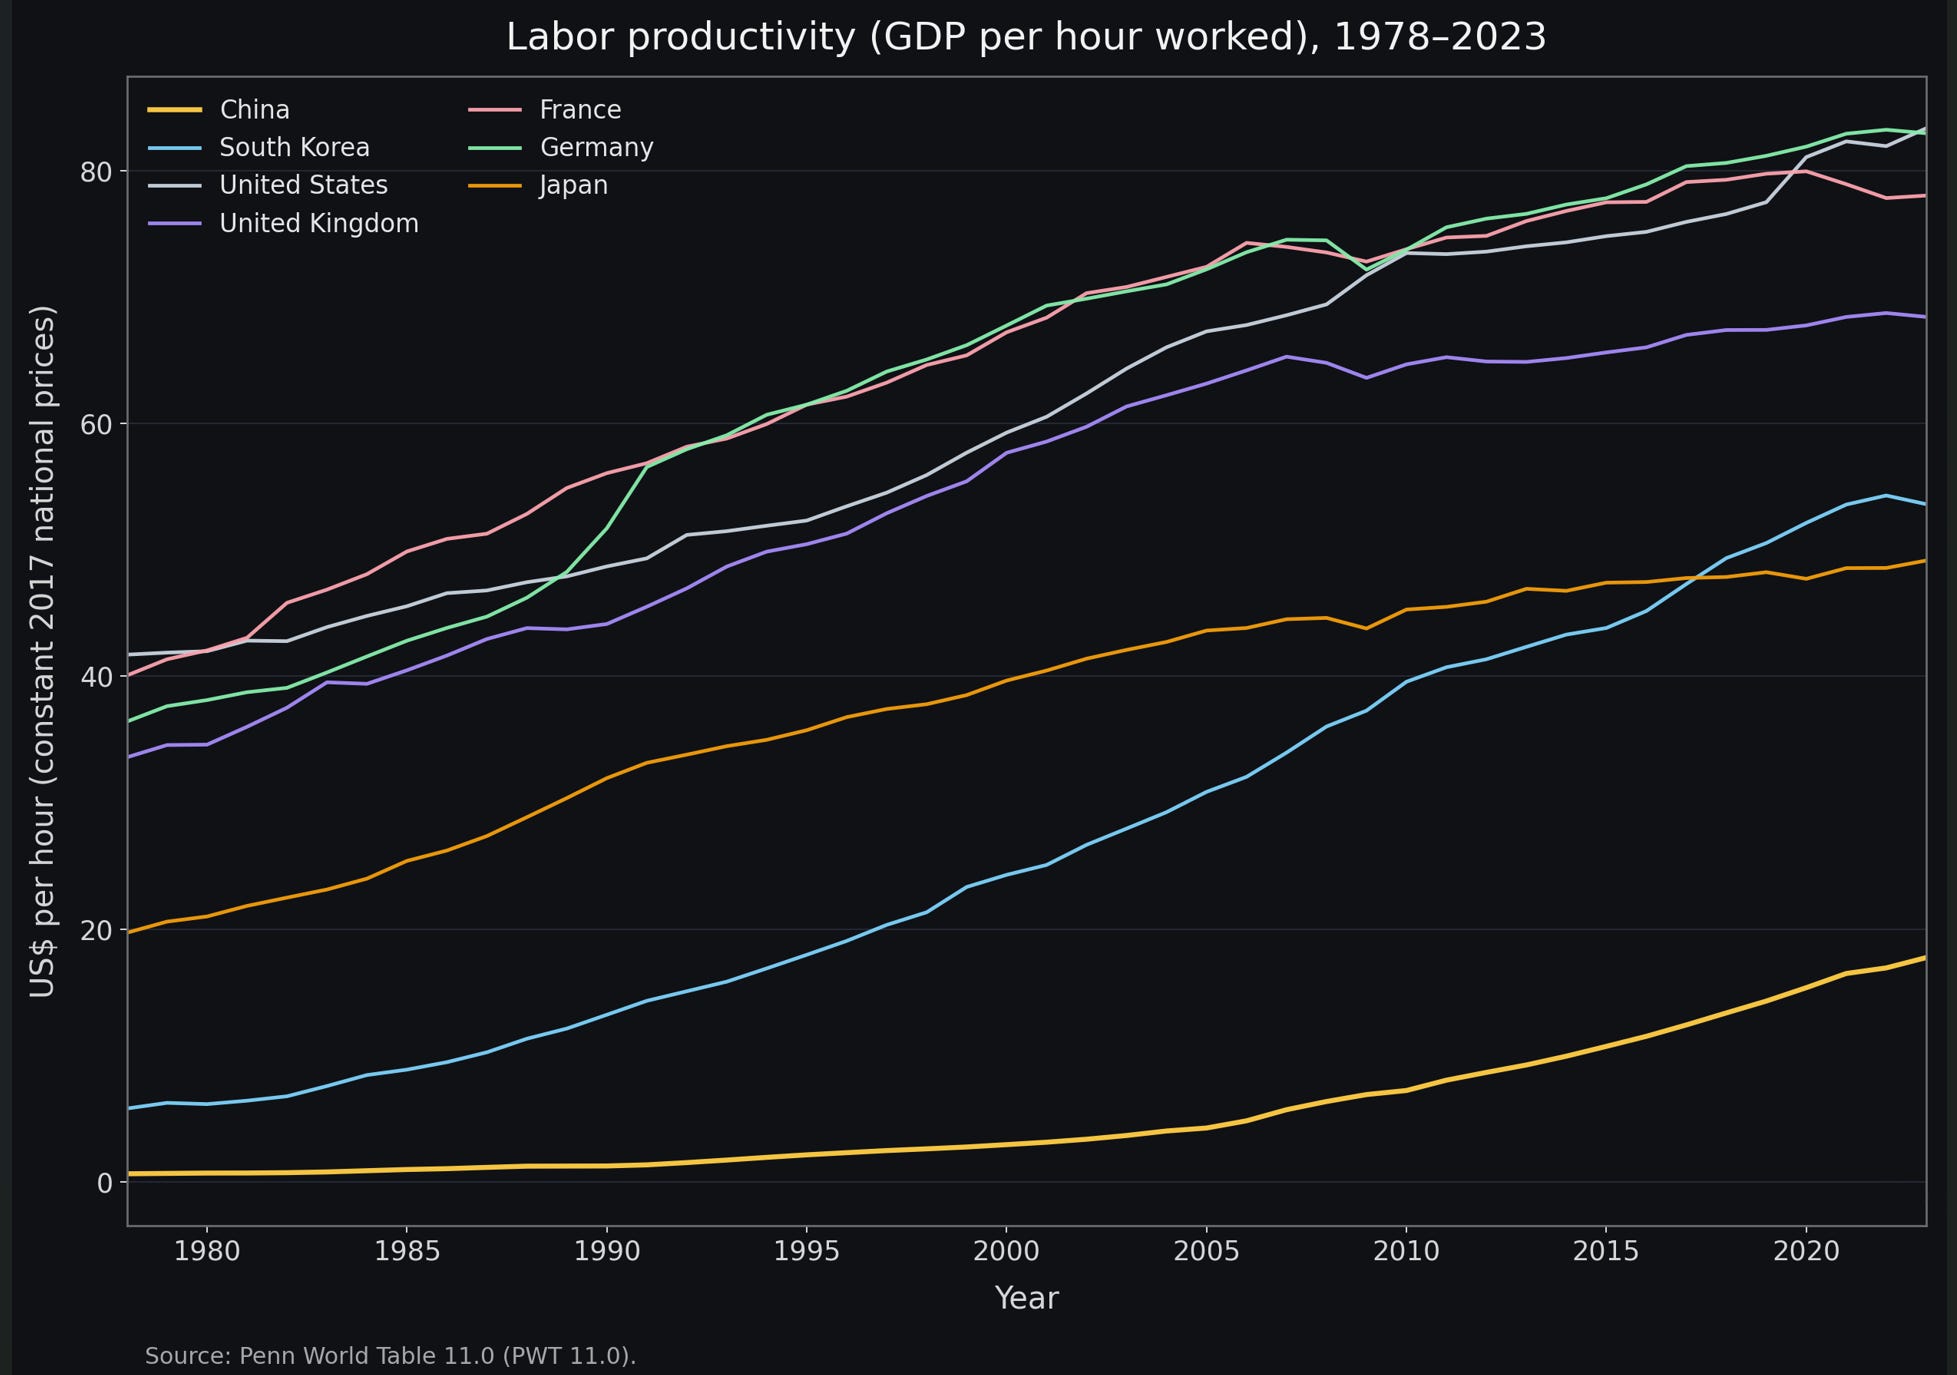
The third indicator is labor productivity (output per hour). China is around $20 per hour, far below the $50–$80 range typical of advanced economies. China’s current labor productivity is broadly comparable to South Korea in the mid-1990s.
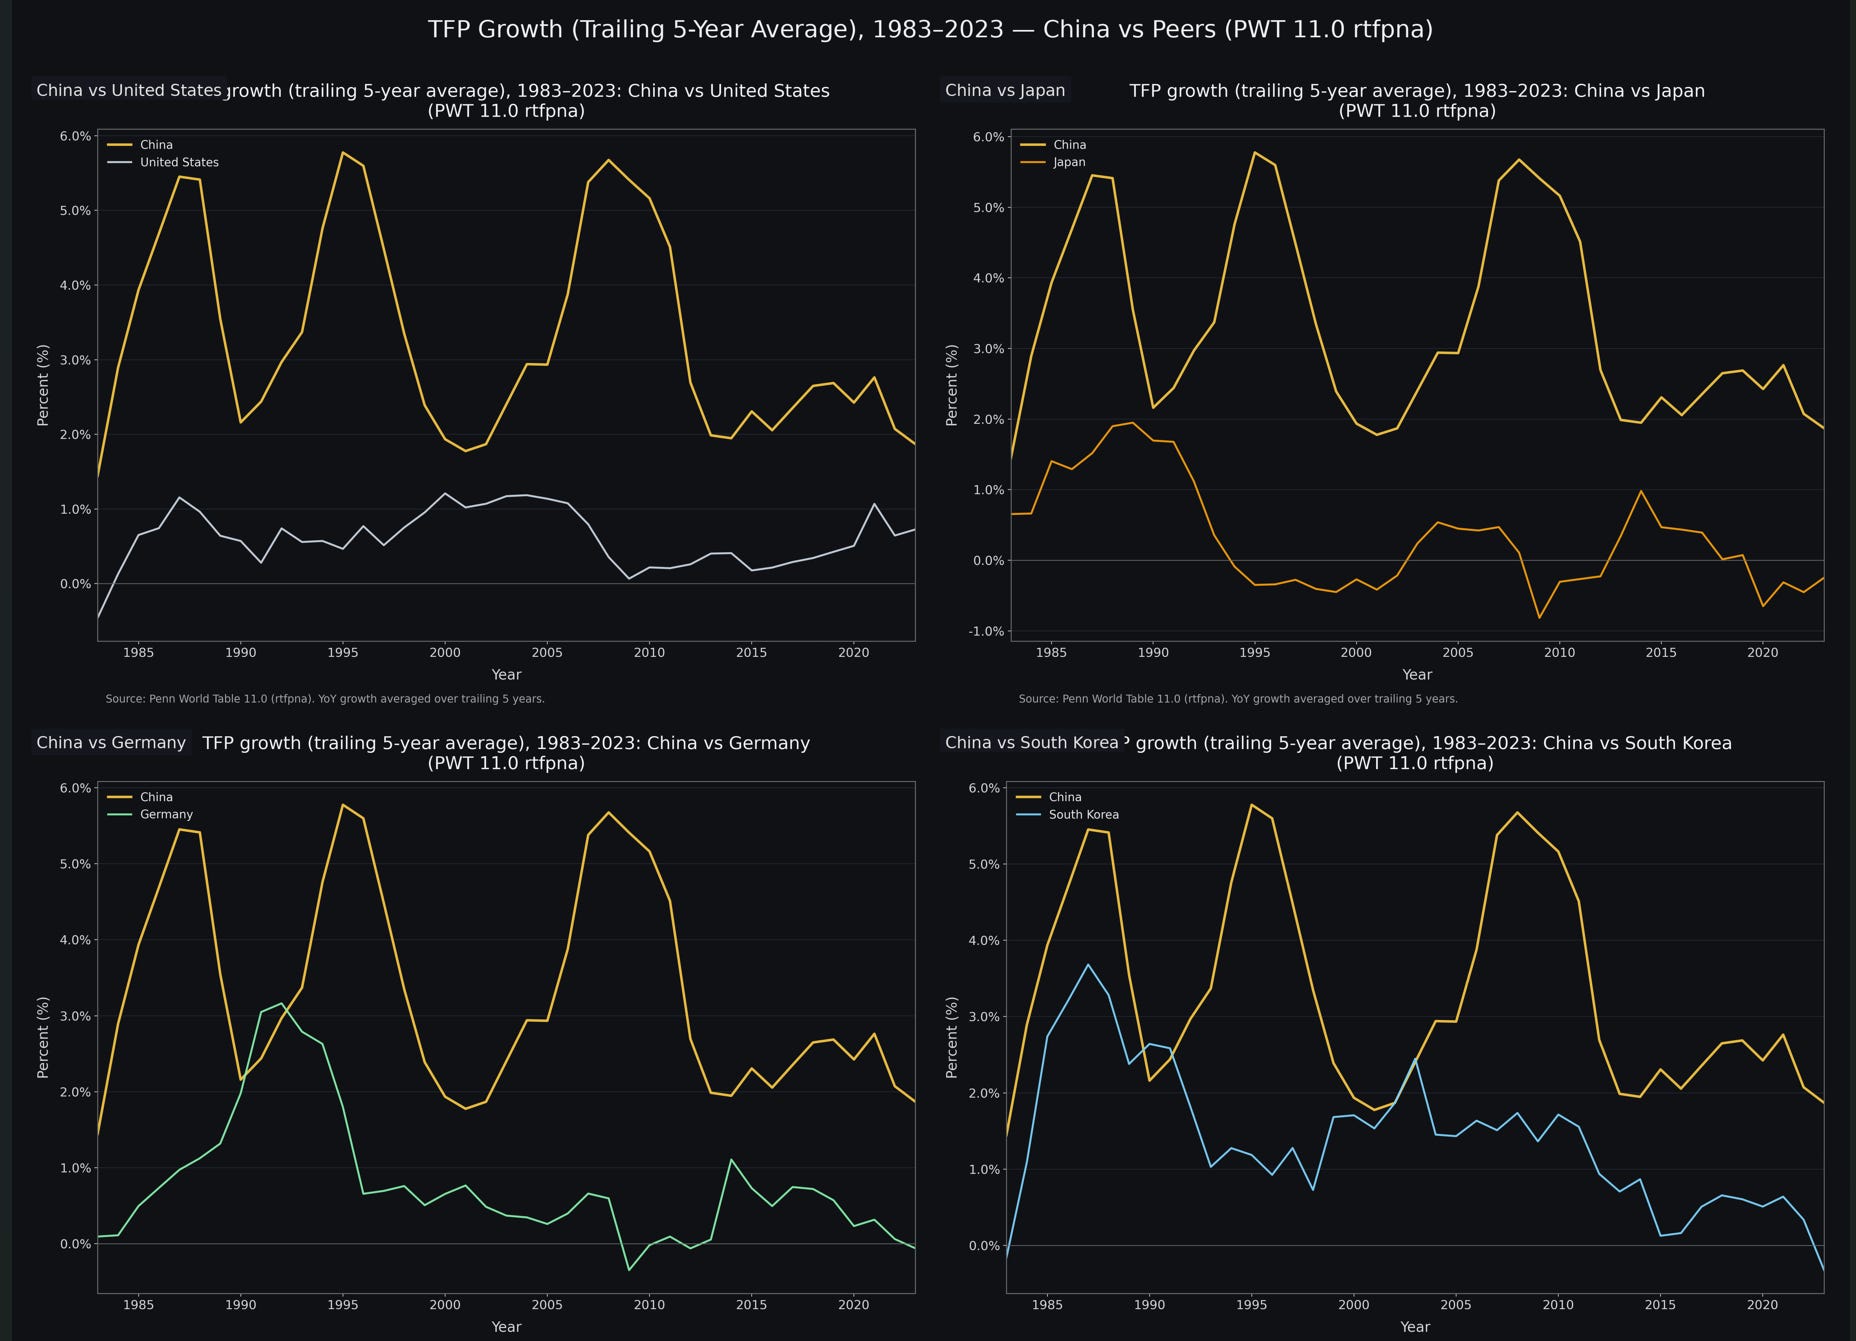
Over the past decade, China’s TFP grew at an average annual rate of 2.17%. South Korea’s average TFP growth over 1995–2023 was 0.93%. Given China’s current productivity stage—measured by PPP GDP per capita, manufacturing value added per capita, and GDP per hour—is close to South Korea around 1995, it is highly likely that China’s average TFP growth over the next 25 years can reach around 1% per year. Another reference point: US and Germany TFP growth over 1995–2023 averaged 0.65% and 0.35%, respectively.
III. Three forces that can sustain productivity gains
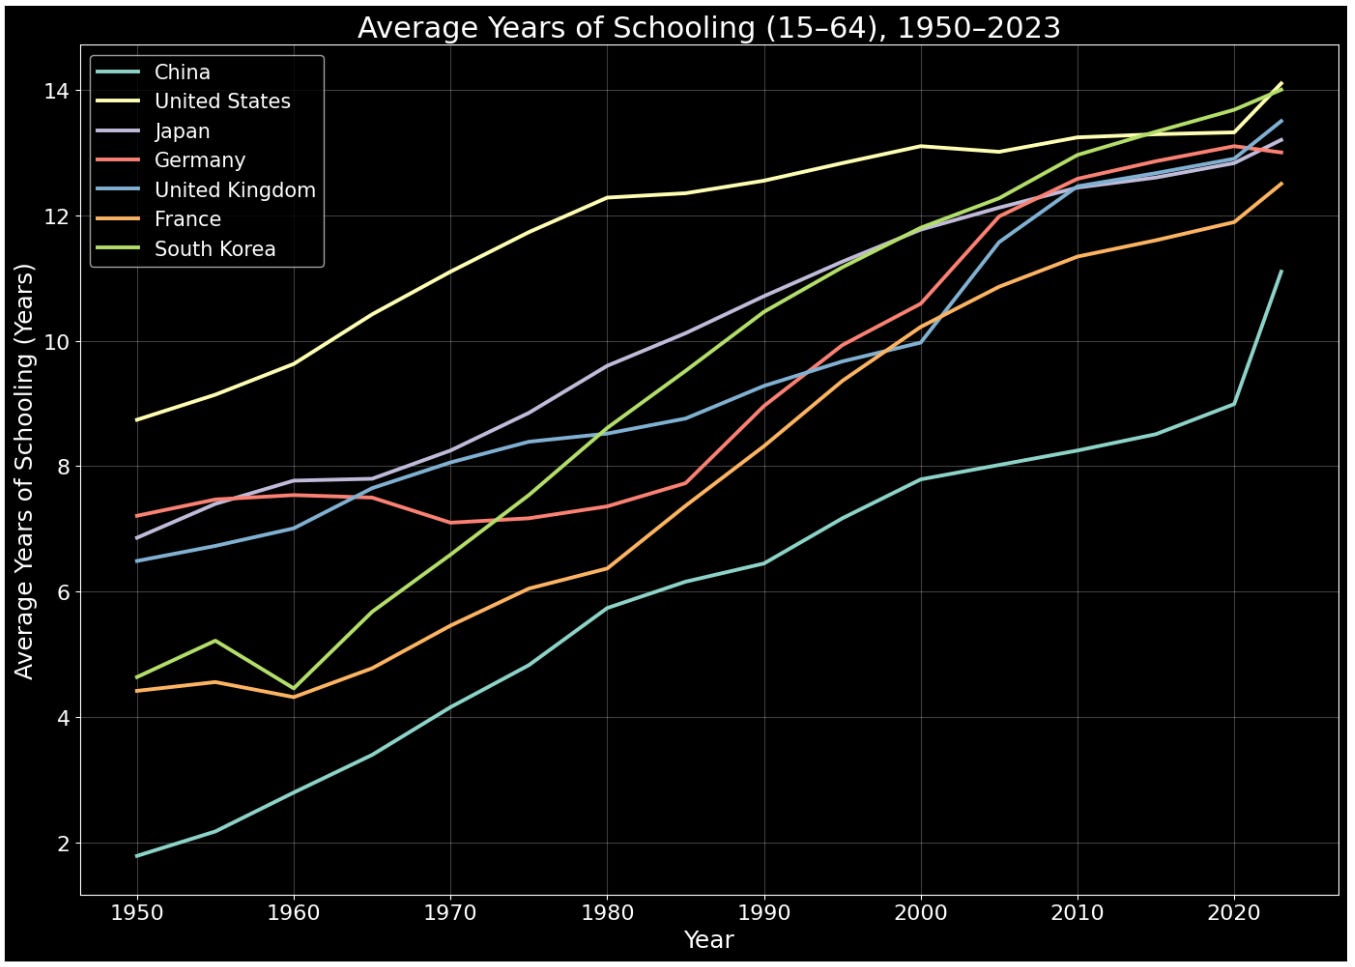
The first is education. The average years of schooling for China’s working-age population has exceeded 11 years, but there remains a meaningful gap versus the US, Germany, Japan, and South Korea. Given China’s current trajectory of higher-education expansion, it is close to certain that over the next 10–20 years this figure rises toward the current level of advanced economies, roughly around 14 years.
International evidence suggests that each additional year of schooling raises an individual’s productive capacity by about 8%–10%. Moving from 11 years to 13.5–14 years implies an increase of 2.5–3 years, which in theory translates to roughly a 20%–30% improvement in labor quality. This implies:
Higher value added per unit time
Stronger capacity to absorb technology
Higher efficiency in translating innovation into productivity
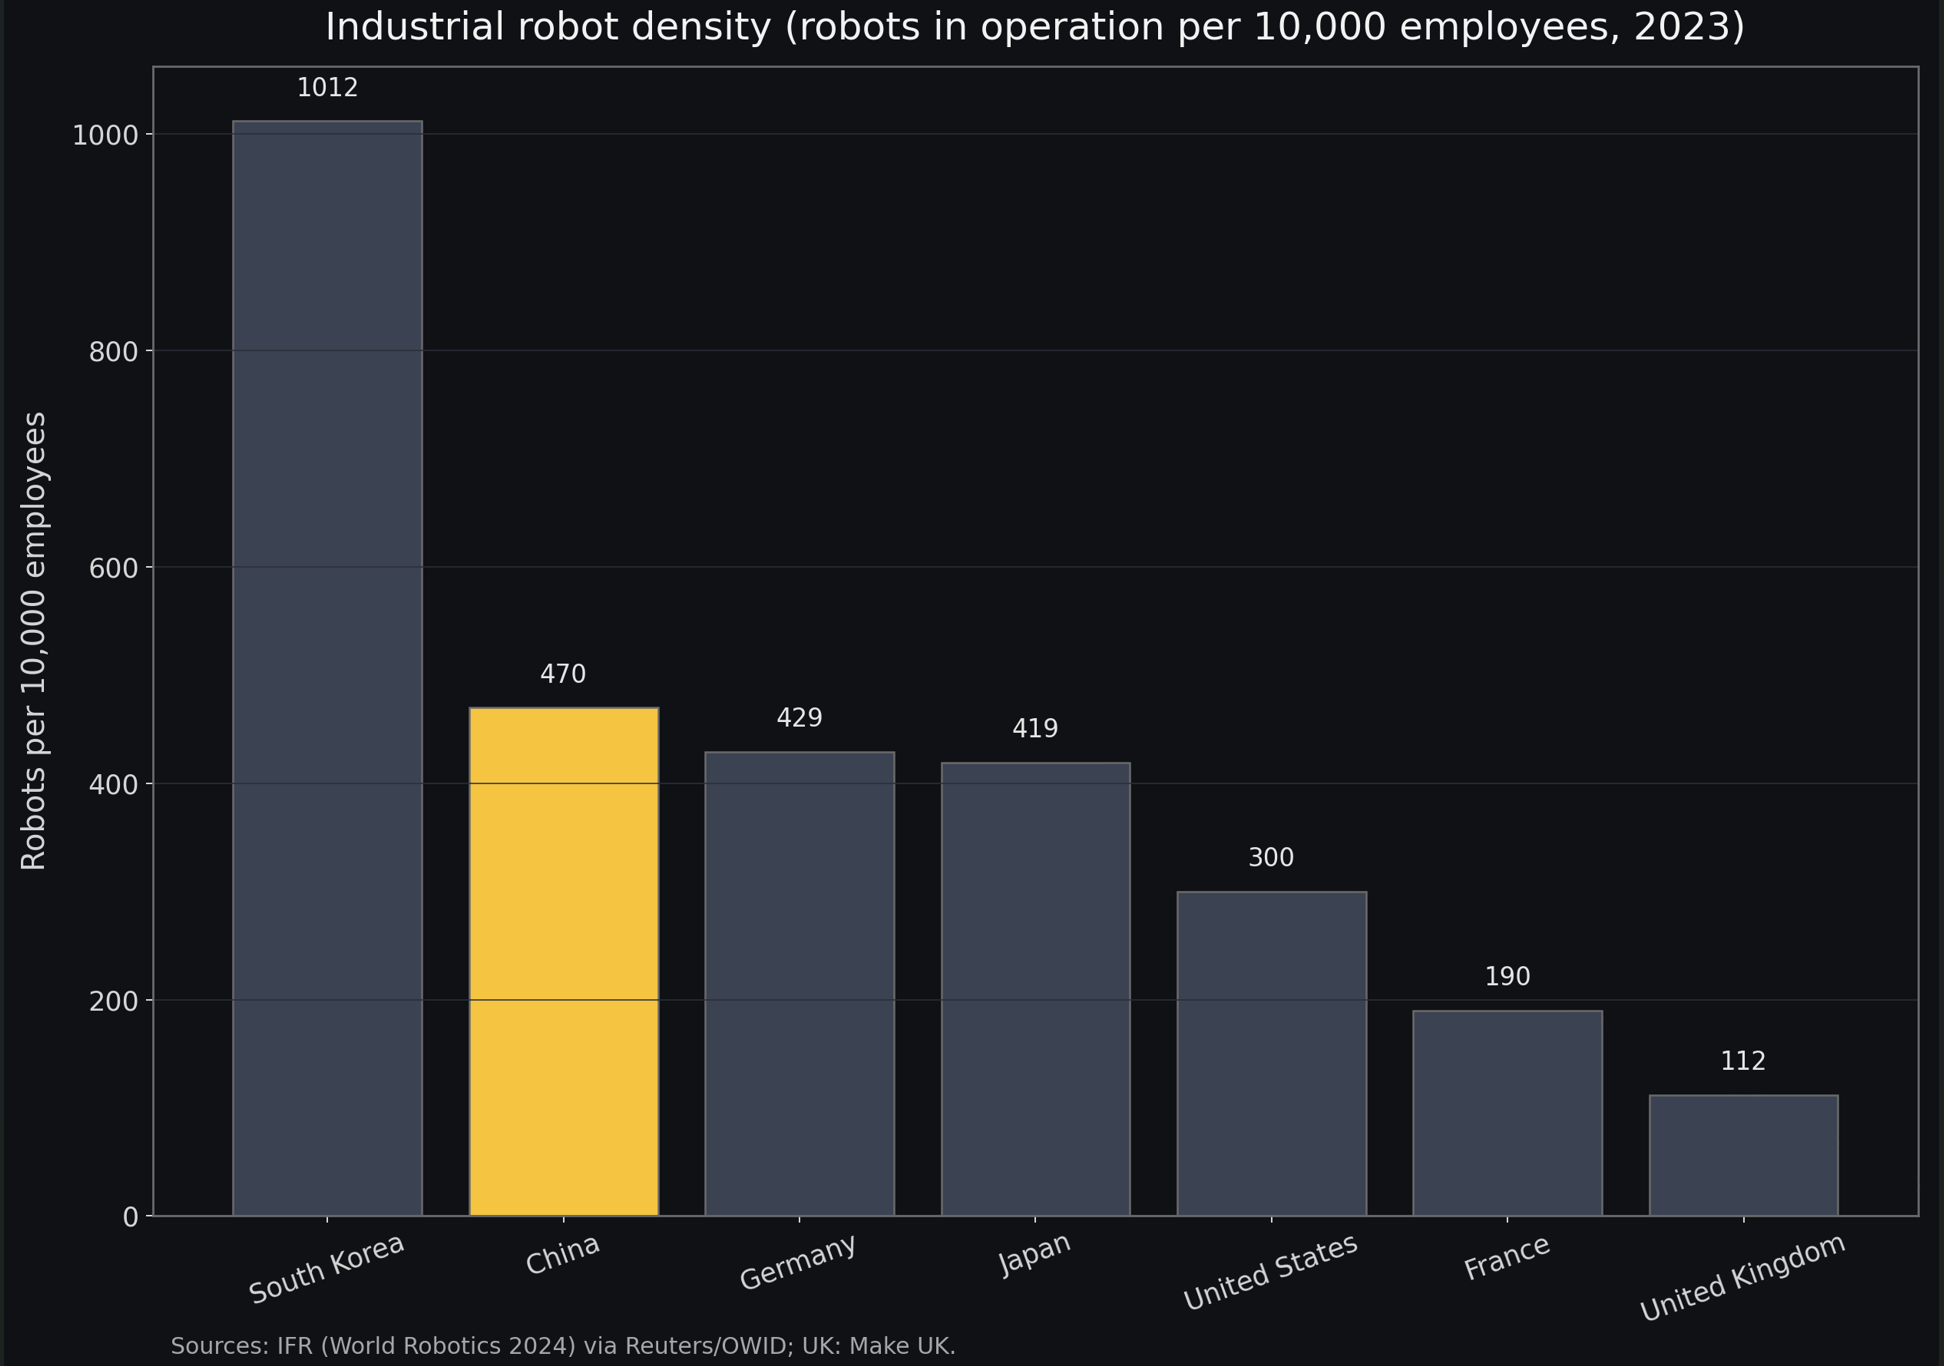
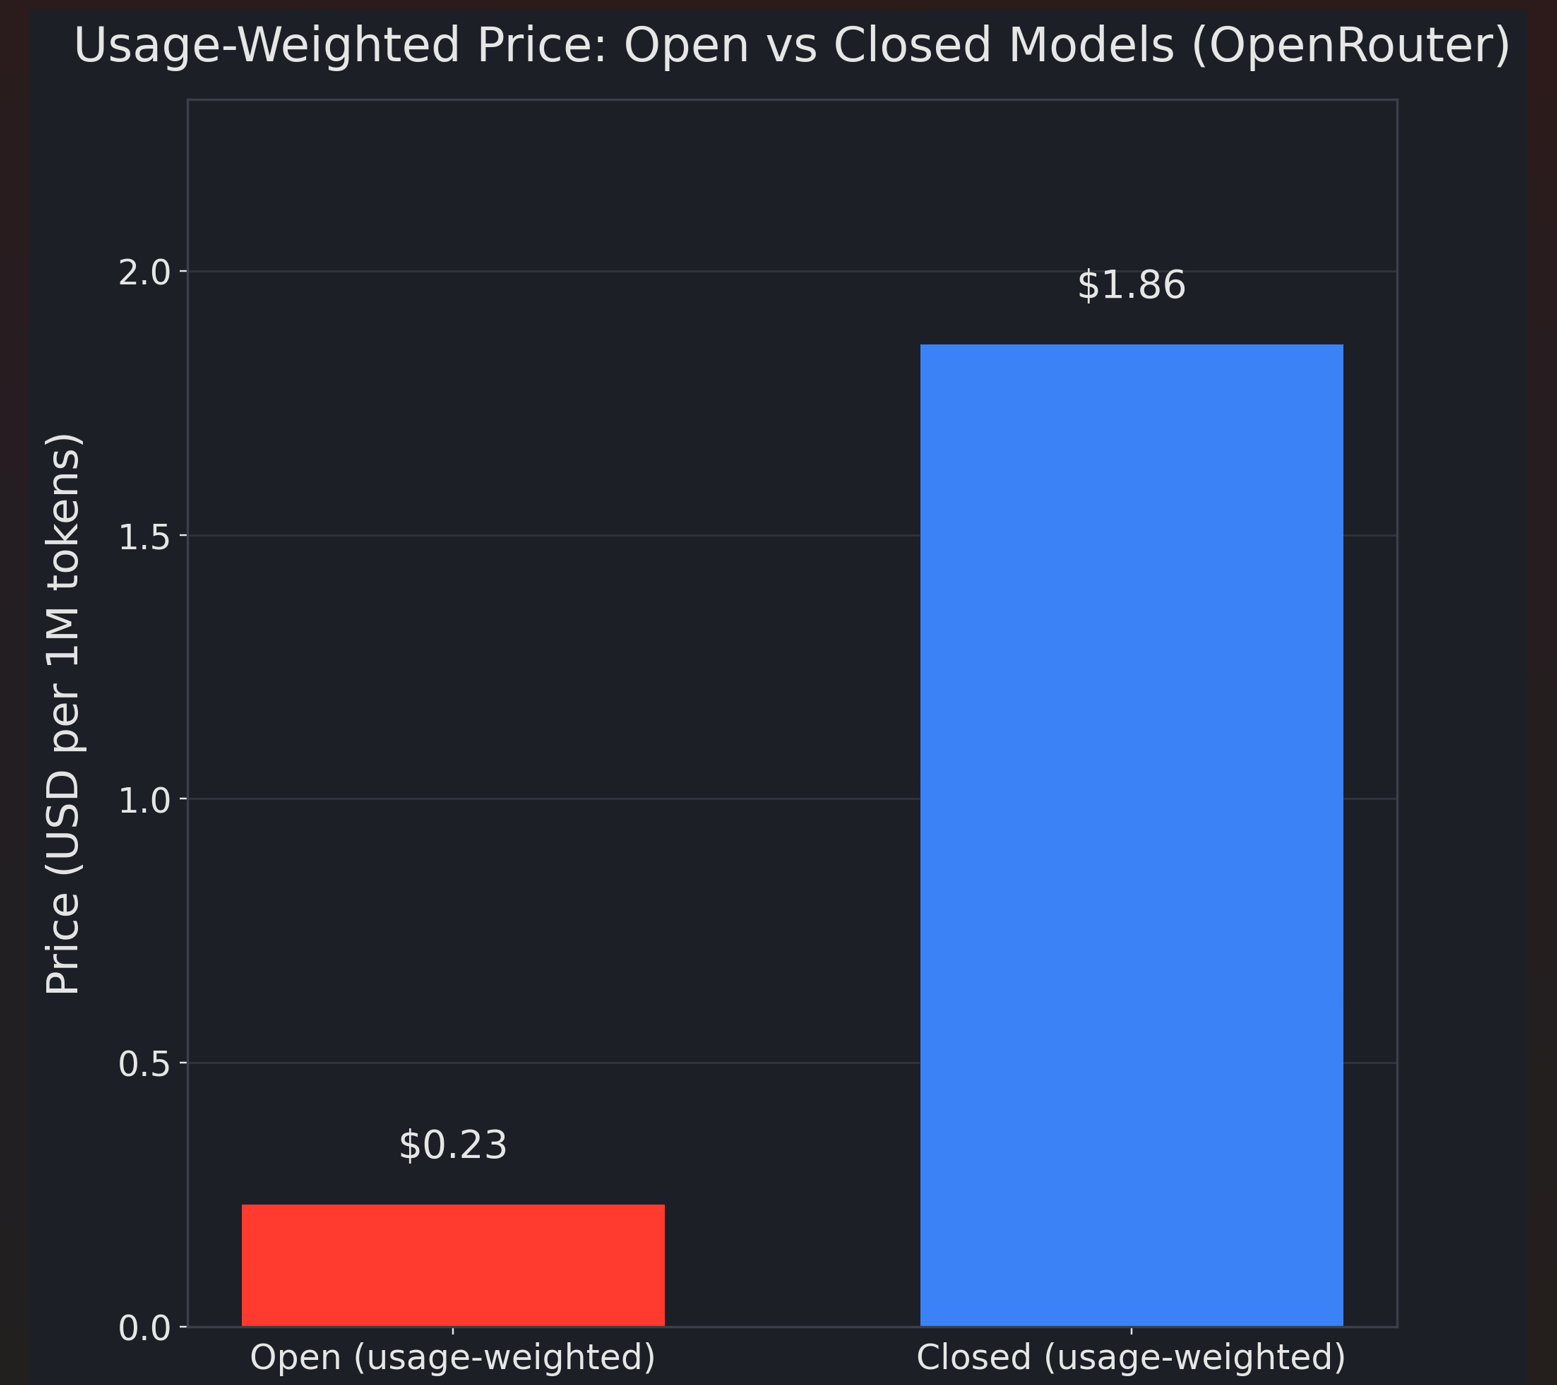
The second is technological progress, especially the large-scale diffusion of industrial automation and AI. China’s industrial robot density is already in the global top tier, ranked second only to South Korea, and higher than Germany, the US, and Japan. Rising automation in manufacturing is, in essence, capital deepening used to offset the decline in labor quantity. At the same time, China is rapidly catching up across the full AI stack. China’s open-source models are already close to 90% of the performance of leading US closed models, while costing only about 20%, and the catch-up cycle keeps shortening, now down to around 13 weeks. Going forward, AI penetration into process optimization, R&D assistance, production scheduling, and supply-chain management could materially reshape the output function of a unit of labor.
The third factor is that institutional reform in China is still ongoing and can continue to release efficiency gains. Taken together, these three forces make it highly likely that China can sustain around 1% annual labor-productivity growth. If AI triggers more transformative changes, growth could even reach the 2%–3% range, more than enough to cover the demographic headwind.
IV. But the most important driver is industrial upgrading
At the most fundamental level, the single most important driver of productivity growth is sustained industrial upgrading. Only by moving the economy toward more sophisticated, higher-value segments can a country create more high-paying industries and capture more value added per unit of output. Viewed through that lens, China still has substantial headroom to raise productivity and climb the value chain. Several indicators point to this upside.
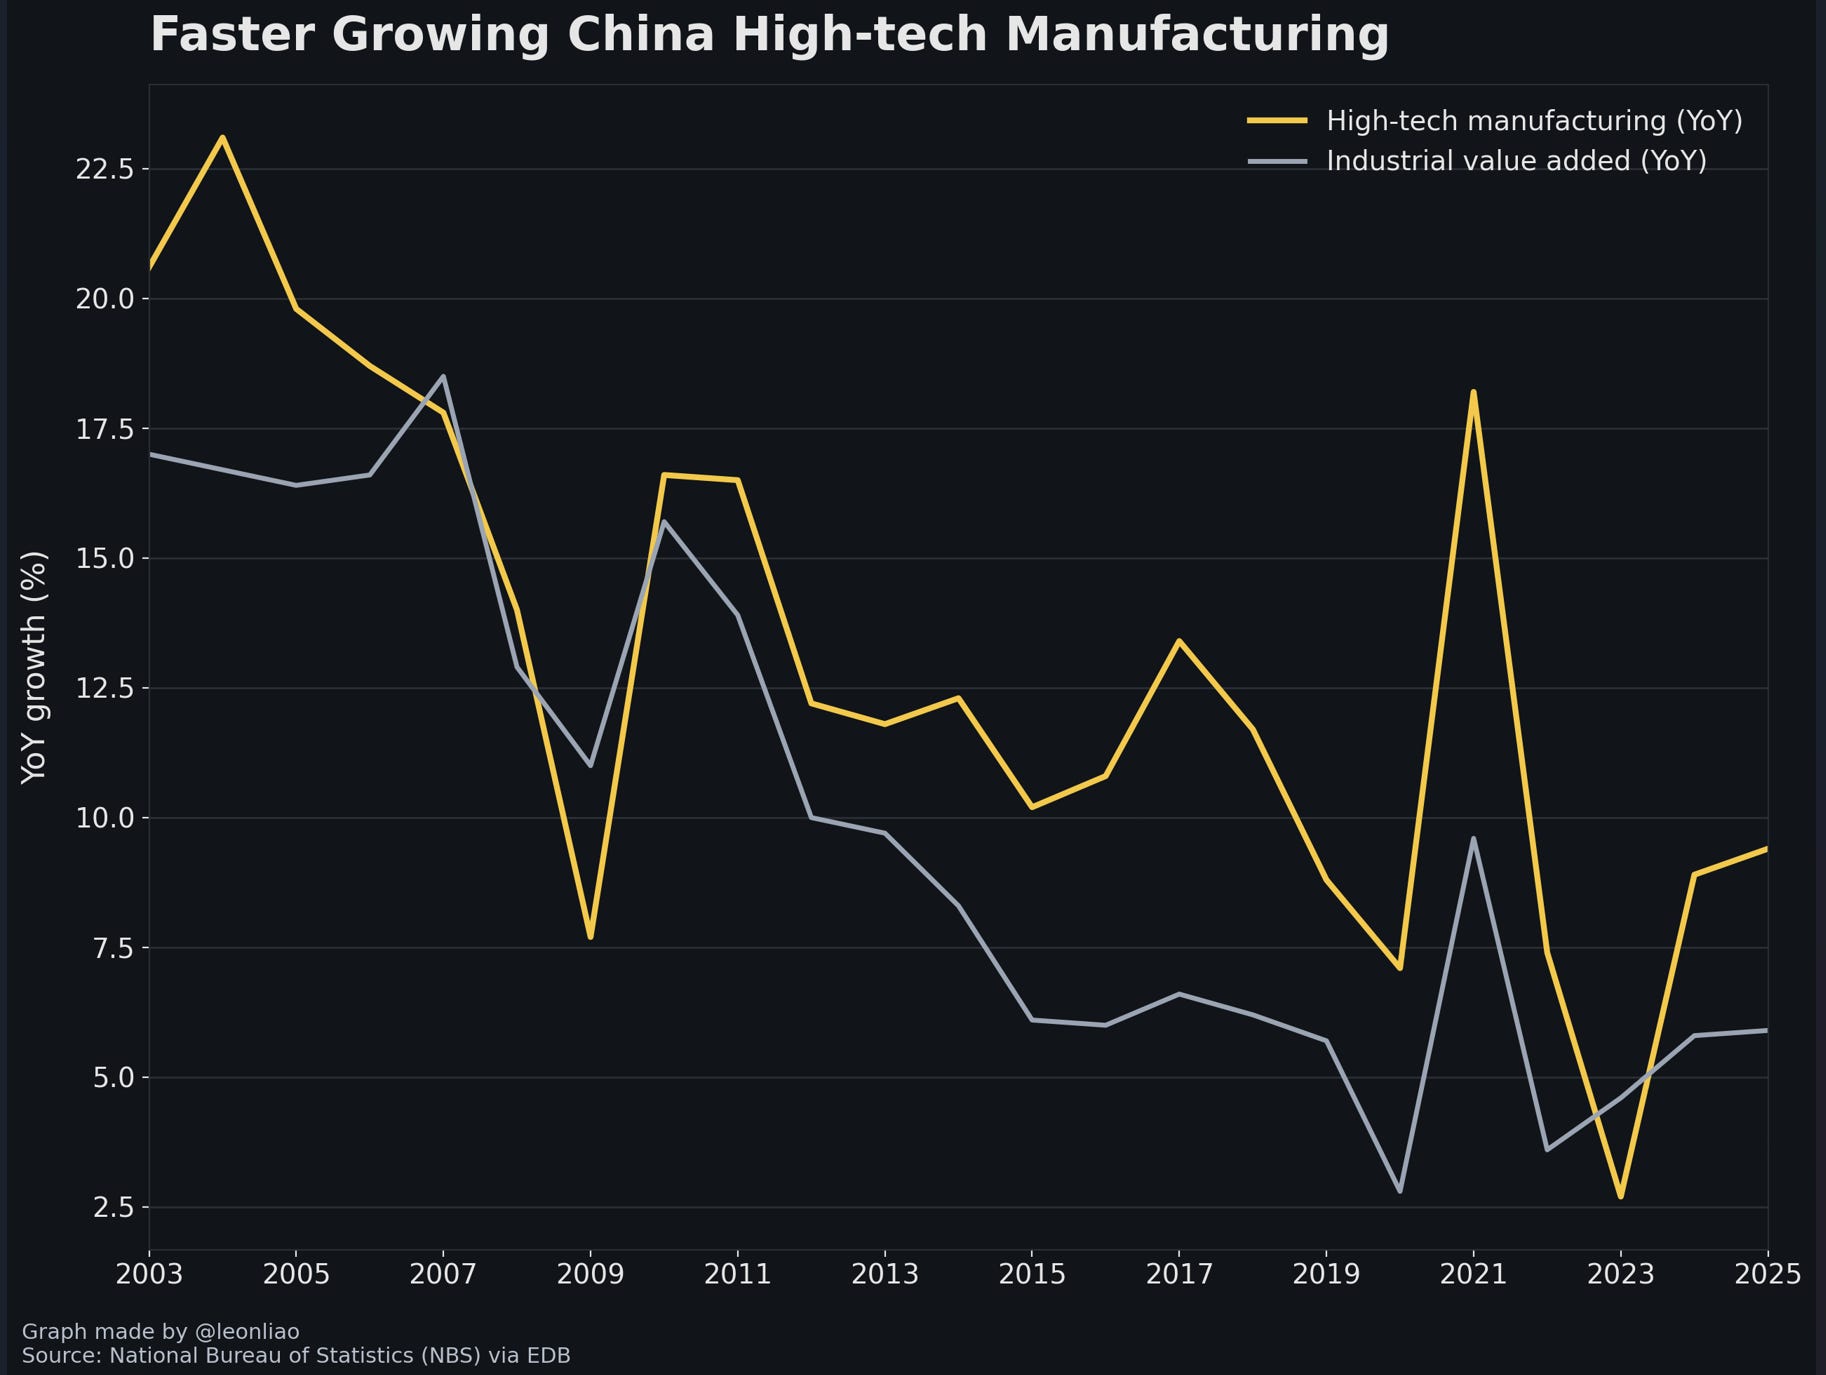
First, the steady rise of high-tech manufacturing. Over the past decade, China’s high-tech manufacturing output has consistently grown faster than overall industrial value added, pushing its share upward over time. Yet even after years of progress, high-tech manufacturing still accounts for only around 15% of manufacturing value-added, suggesting that a large portion of the industrial base remains concentrated in mid- to lower-value segments where productivity gains and wage growth tend to be more constrained.
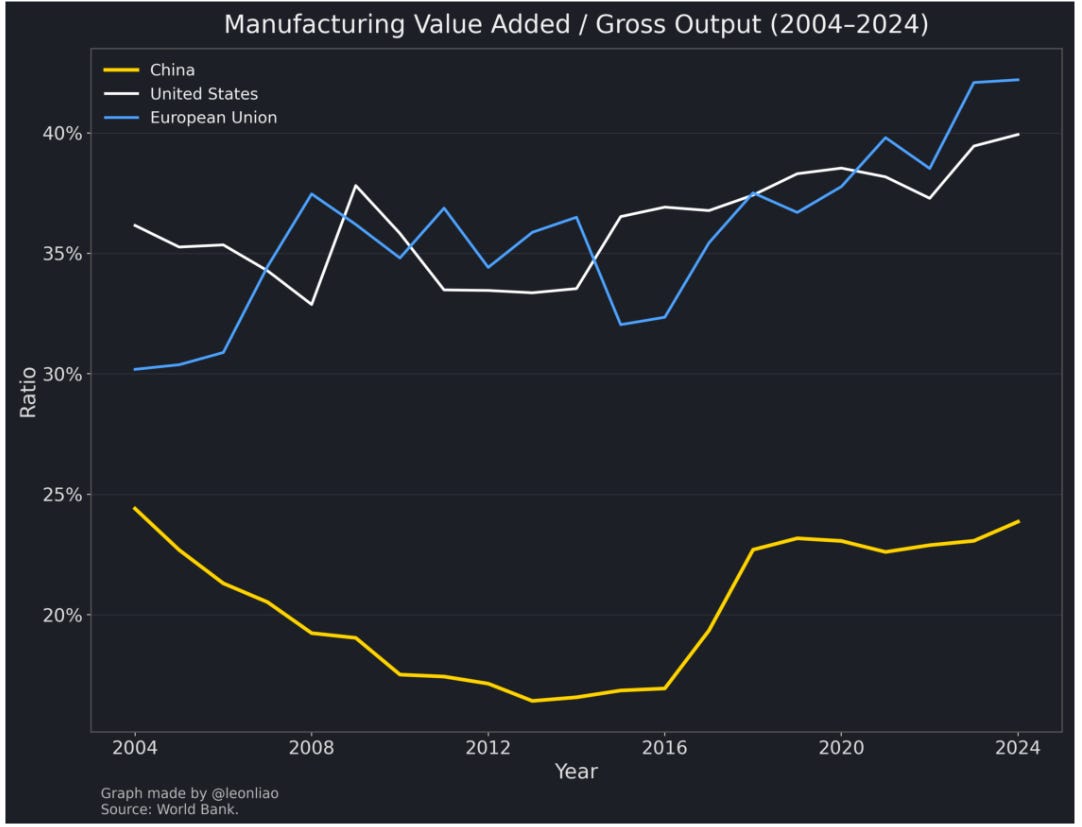
Second, the value-added ratio within manufacturing. In 2024, China’s manufacturing value added as a share of gross manufacturing output was only about 24%, far below roughly 40% in the United States and about 42% in the European Union. This gap matters because it reflects how much economic value is retained domestically—through technology content, branding, core components, software, advanced processes, and high-margin services embedded in manufacturing—rather than being competed away in low-margin assembly, commoditized processing, or upstream input costs. The contrast is especially striking given China’s scale: it accounts for roughly 35% of global gross manufacturing output, but less than 30% of global manufacturing value added. In other words, China has become the world’s largest manufacturing platform, but it still captures a disproportionately smaller share of the profit pools and high-value functions compared with advanced economies.
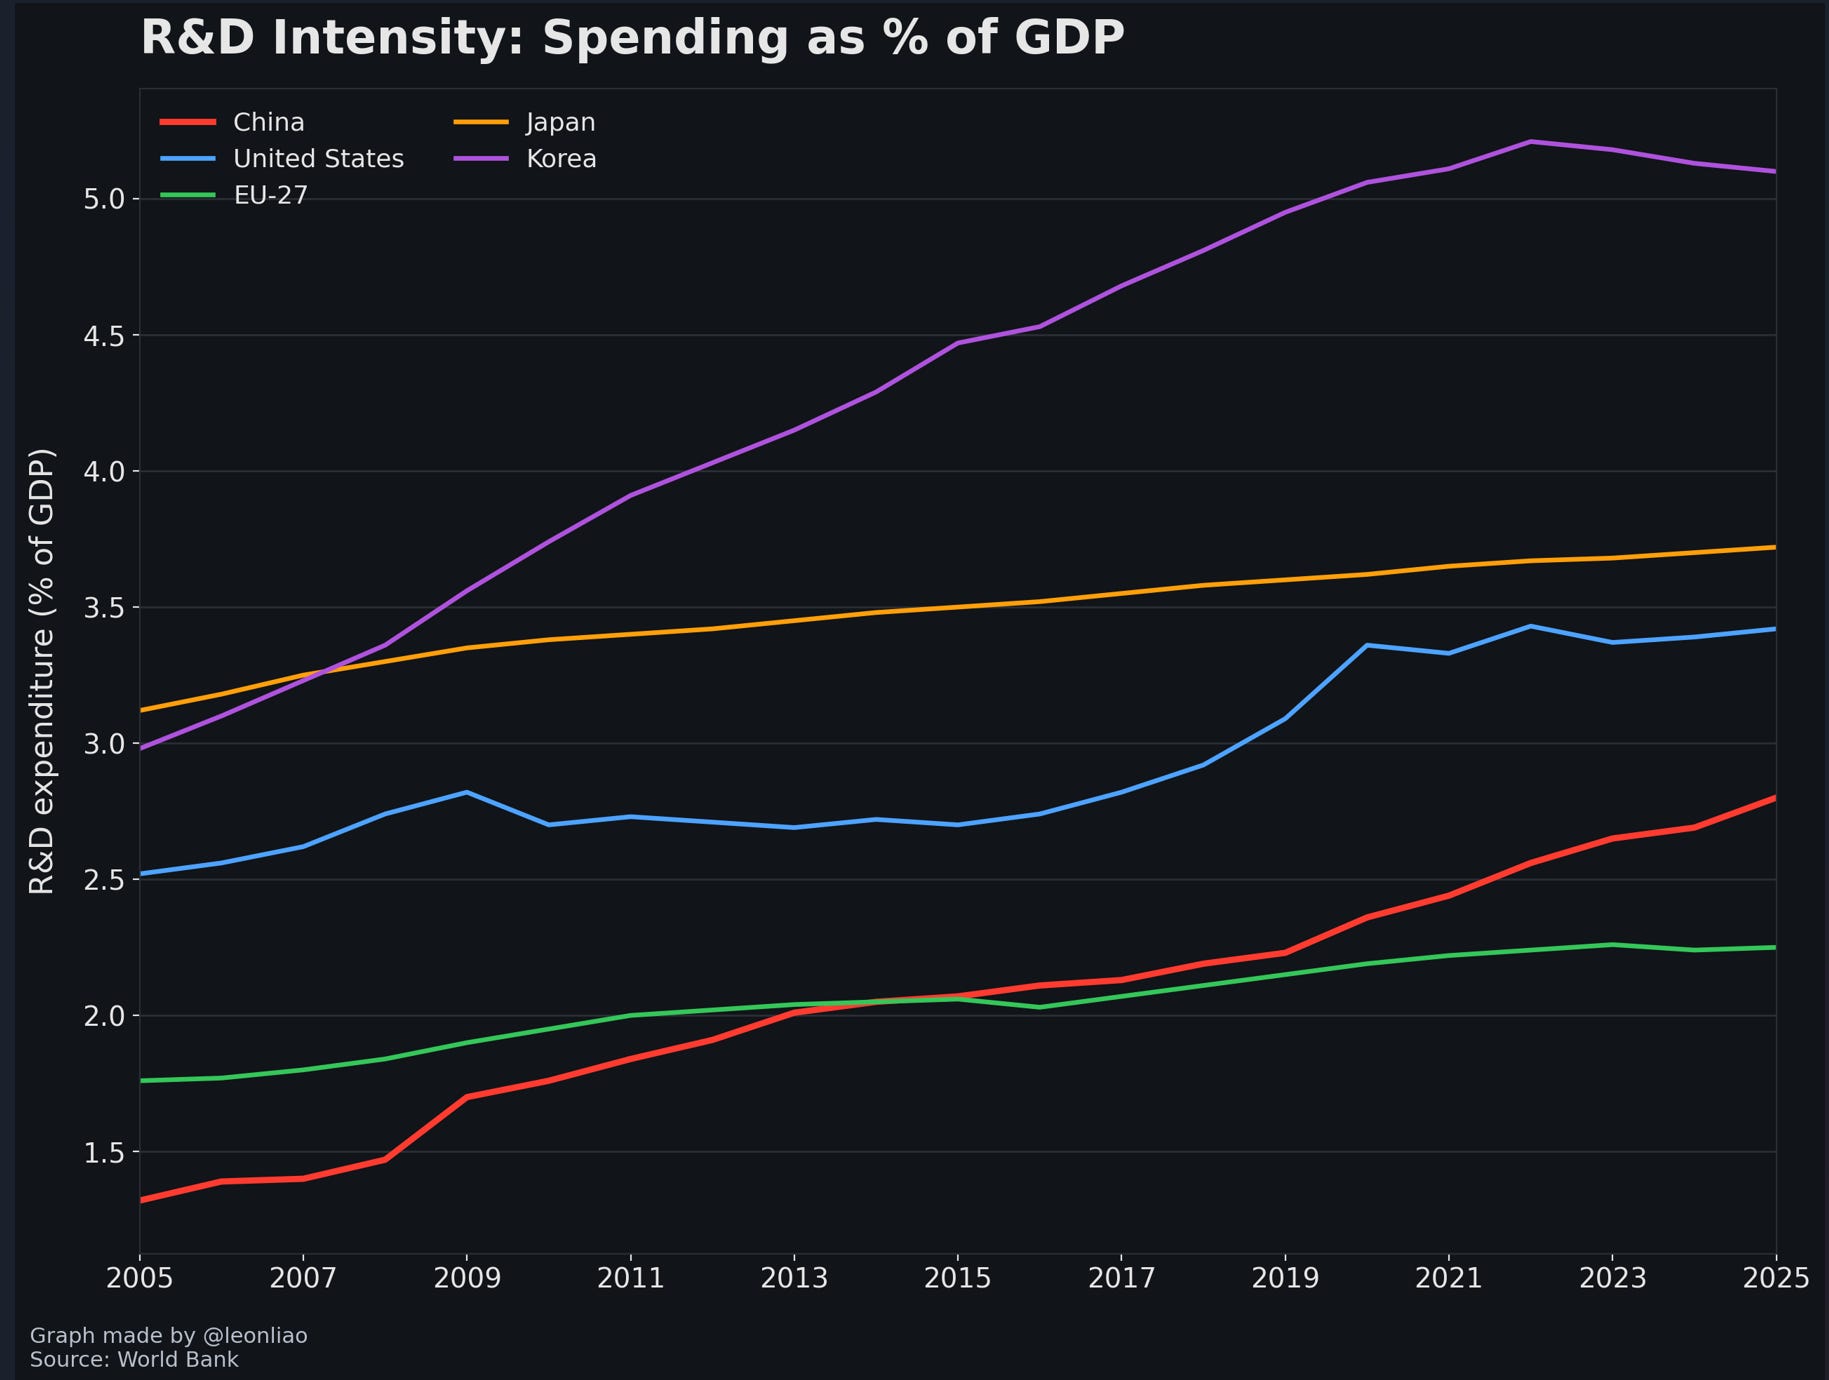
Third, R&D intensity. China’s R&D expenditure as a share of GDP has risen steadily and surpassed the EU level about a decade ago, reflecting a sustained national push to build innovation capacity. Even so, a meaningful gap remains versus the frontier economies—particularly the United States, Japan, and South Korea—where R&D intensity is higher and where a larger portion of R&D is translated into proprietary technology, standards, platforms, and globally priced products. Closing this gap is not just about spending more; it is about improving research productivity, strengthening commercialization channels, and expanding the share of innovation that converts into high-margin industrial outcomes.
Taken together, these three dimensions describe the same structural story from different angles: China has already achieved manufacturing scale, but the next phase of productivity growth depends on increasing the share of high-tech output, raising value added per unit of manufacturing activity, and deepening innovation intensity—so that the economy can move from being primarily a global production hub toward becoming a global source of technologies, components, and brands that command pricing power.
V. Conclusion and outlook
Over the next 25 years, China will face a severe demographic headwind. The population could decline by 230 million, roughly equivalent to subtracting the combined populations of Russia and Japan, a 16% drop, or an average decline of 0.8% per year. Yet improvements in education, automated production, and institutional reforms can still plausibly deliver around 1% annual productivity gains, offsetting much of the demographic drag. Combined with continued capital accumulation, a conservative estimate is that China can still sustain close to 3% average annual real growth over the next 25 years. If inflation, currency appreciation, and related factors are also considered, nominal GDP growth should be higher.
If the Chinese government significantly increases fertility subsidies to arrest the decline in total fertility, and if AI-driven productivity gains exceed expectations, long-run real GDP growth could plausibly land in the 3%–4% range.